Storm Introduction
On August 10th 2020, a derecho outbreak across much of the Midwest from South Dakota to Indiana was dubbed an "inland hurricane" by the media and caused nearly $11 billion in damages. Defined as "a line of intense, widespread, and fast-moving windstorms and sometimes thunderstorms that moves across a great distance and characterized by damaging winds" this late summer storm system spawned near the Nebraska and South Dakota border moving quickly East. Through the combination of widespread commercial & private damages, utility failures, and mass crop destruction, millions were affected with parts of Eastern Iowa and Northern Illinois being hit the hardest. Presented below is the NOAA's summary of wind gusts along the derecho path spanning 770 miles in 14 hours, traveling Eastward at a velocity of 55 miles per hour., Figure 1.
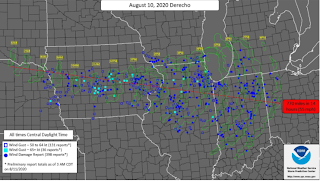 |
| Figure 1: Storm Reports Received by SPC |
Environmental Conditions
As previously mentioned, while the derecho was formed over South Dakota and Nebraska, the largest damages and severe weather occurred in Eastern Iowa and Northern Illinois. This split among geography can be explained by focusing on differential instabilities in the region. In Figure 2 we can see what played a key roll in contributing to the large instabilities over Iowa and Illinois as an influx of warm and moist air advection from Minnesota. This advection of unstable air bred an environment suitable for storm intensification. Though sounding data from the derecho impacted Eastern Iowa around 18Z is unavailable, contours of Convective Available Potential Energy, CAPE, are shown in Figure 3 detailing the loaded conditions ripe for severe weather.
 |
Figure 2: Surface Observations at 21:00 UTC
|
 |
| Figure 3: 100mb Mixed Layer CAPE at 21:00 UTC |
Radar Analysis
Investigating our event, radar base reflectivity data from the 18-19 UTC hours of August 10, 2020 reveal a well defined structure of high reflectivity values. The bow shaped signature of high reflectivity, 45-55 dBZ suggesting torrential rain or larger hydrometeors, of convective storm systems are indicative a classic derecho. Surrounding the high-reflectivity bow are widespread areas of convective rain. For derecho's, peaks activity of rainfall and thunderstorms are located at the bow apex, a structure found in our base reflectivity imagery, Figure 4.
 |
| Figure 4a: 0.5 Degree Base Reflectivity via KDMX |
 |
Figure 4b: 0.9 Degree Base Reflectivity via KDMX
|
 |
Figure 4c: 1.3 Degree Base Reflectivity via KDMX
|
Throughout the height of the storm, growing radar elevation angles view multiple layers of the storm and still reveal our classic bow-shaped reflectivity. The high consistency between imagery and elevation demonstrates the extent of deep convection present in the derecho. The areas of highest consistency, those with highest reflectivity, show the tallest features of storm with greatest regions of convection located near the borders of Iowa and Illinois ~ 250 km East of the radar and ~ 200 km South of the radar as well.
 |
Figure 5a: 0.5 Radial Velocity via KDMX
|
 |
Figure 5b: 1.3 Radial Velocity via KDMX
|
|
|
Along with base reflectivity data, radial velocity imagery taken from Des Moines illustrates another classic derecho feature, strong straight-line damaging winds. In Figure 5, radial velocity data details the wind speeds and directions associated with the derecho. Early in the 18-19 Z hour, winds are shown to steadily move East with high speeds of 60-70 knots. In the last three time steps, evidence of velocity folding directly east of the radar is shown 100-200 km away. This can be seen as positive values of velocity surround green negative values. Not to be confused with a velocity couplet which have tight gradients with a zero-isodop, this image should be interpreted as velocity folding as there is no zero line of perpendicular winds to the radar. This phenomena occurs when straight-line winds are fast enough that they wrap around the scale. Observed wind speeds in the areas under the velocity folding like Cedar Rapids were measured to be over 120 miles an hour.
 |
Figure 6a: 0.5 Correlation Coefficient via KDMX
|
 |
Figure 6b: 0.9 Correlation Coefficient via KDMX
|
 |
Figure 6c: 1.3. Correlation Coefficient via KDMX
|
Lastly, radar instruments such as correlation coefficient and differential reflectivity were analyzed to investigate the precipitation and homogeneity of the storm (Figures 6 & 7). Briefly referencing the two sets of images with known facts of the storm, while there were low values of correlation coefficients throughout elevation angles and timesteps in the Northeastern corner of Iowa, no reports of hail were present in the event summary. It is possible that debris swept from the 100 mile per hour gusts prevalent in this area were tracked on the radar, other values of low correlation coefficient near that radar are likely ground clutter. The varying values of differential reflectivity from near zero to 1-2 suggest moderate rain in the area and high values colored in white correlate well with the areas interpreted to be ground clutter.
 |
Figure 7a: 0.5 Degree Differential Reflectivity via KDMX
|
 |
Figure 7b: 1.3 Degree Differential Reflectivity via KDMX
|
Overall, a derecho of this magnitude was dubbed a once a decade event with estimated wind gusts of 140 miles per hour with two tornados (EF unknown). While derechos are not unknown to this area, the severity and duration of the event with winds gusting at peak levels for up to an hour separate this storm system. Many injuries were recorded across the state along with one fatality.


Comments
Post a Comment